DebugSwift is a comprehensive toolkit designed to streamline and elevate the debugging experience for Swift-based applications. Whether you are troubleshooting issues or optimizing performance, DebugSwift offers a powerful set of features to make your debugging process more efficient and effective.
|
| | |
---
## 📋 Table of Contents
- [🚀 Features](#features)
- [🛠 Installation & Setup](#installation--setup)
- [🔧 Troubleshooting](#troubleshooting)
- [📝 Examples](#examples)
- [🔧 Configuration](#configuration)
## Requirements
- **iOS 14.0+**
- **Swift 6.0+**
- **Xcode 16.0+**
## Features
### 🌐 Network Inspector
- **HTTP Monitoring:** Capture all requests/responses with detailed logs and filtering
- **WebSocket Inspector:** Zero-config automatic monitoring of WebSocket connections and frames
- **Request Limiting:** Set thresholds to monitor and control API usage
- **Smart Content:** Automatic JSON formatting with syntax highlighting
- **Encryption Support:** Automatic decryption of encrypted API responses with AES-256/128 and custom decryptors
- **Response Modifier:** Mock or modify any API responses in real time. Adjust the response body and status based on URL or patterns, enable or disable rules individually, import/export configurations via CSV, body editor, and generate rules from live network traffic.
### ⚡ Performance
- **Real-time Metrics:** Monitor CPU, memory, and FPS in real-time
- **Memory Leak Detection:** Automatic detection of leaked ViewControllers and Views
- **Thread Checker:** Detect main thread violations with detailed stack traces
- **Performance Widget:** Overlay displaying live performance stats
### 📱 App Tools
- **Crash Reports:** Detailed crash analysis with screenshots and stack traces
- **Console Logs:** Real-time console output monitoring and filtering
- **Device Info:** App version, build, device details, and more
- **APNS Tokens:** Easy access and copying of push notification tokens
- **Custom Actions:** Add your own debugging actions and info
### 🎨 Interface Tools
- **Grid Overlay:** Visual alignment grid with customizable colors and opacity
- **View Hierarchy:** 3D interactive view hierarchy inspector
- **Touch Indicators:** Visual feedback for touch interactions
- **Animation Control:** Slow down animations for easier debugging
- **View Borders:** Highlight view boundaries with colorization
- **SwiftUI Render Tracking (Beta):** Automatically detect and visualize SwiftUI view re-renders with dedicated settings screen
- **Documentation Recorder:** Record app interactions with annotated screenshots — taps shown as numbered circles, scrolls as arrows. Save, copy as grid, or share recordings
### 📁 Resources
- **File Browser:** Navigate app sandbox and shared app group containers
- **UserDefaults:** View and modify app preferences at runtime
- **Keychain:** Inspect keychain entries
- **Database Browser:** SQLite and Realm database inspection
- **Push Notifications:** Simulate push notifications with templates and test scenarios
- **SwiftData Browser (iOS 17+):** Inspect registered SwiftData containers, browse models, inspect properties/relationships, edit values, and export JSON
## Installation & Setup
### 🍃 Swift Package Manager (Recommended)
Add to your `Package.swift`:
```swift
dependencies: [
.package(url: "https://github.com/DebugSwift/DebugSwift.git", from: "1.0.0")
]
```
Or add through Xcode: `File` > `Add Package Dependencies` > Enter URL:
```
https://github.com/DebugSwift/DebugSwift
```
### 🎯 CocoaPods
#### Option 1: Source Distribution (Standard)
Add to your `Podfile`:
```ruby
pod 'DebugSwift'
```
#### Option 2: XCFramework Distribution (Faster Builds) ⚡
Add to your `Podfile`:
```ruby
pod 'DebugSwift', :http => 'https://github.com/DebugSwift/DebugSwift/releases/latest/download/DebugSwift.xcframework.zip'
```
### 🍎 Apple Silicon Support
DebugSwift **fully supports Apple Silicon Macs** with native arm64 simulator builds! No more architecture exclusions or compatibility issues.
**Supported Architectures:**
- 📱 **iOS Device**: arm64
- 🖥️ **iOS Simulator**: arm64 (Apple Silicon) + x86_64 (Intel)
**Migration Note:** If you were using architecture exclusions like `'EXCLUDED_ARCHS[sdk=iphonesimulator*]' => 'arm64'`, you can now **remove them** as they are no longer needed.
### Basic Setup
```swift
import DebugSwift
@main
class AppDelegate: UIResponder, UIApplicationDelegate {
private let debugSwift = DebugSwift()
func application(
_ application: UIApplication,
didFinishLaunchingWithOptions launchOptions: [UIApplication.LaunchOptionsKey: Any]?
) -> Bool {
#if DEBUG
debugSwift.setup()
// debugSwift.setup(disable: [.leaksDetector])
debugSwift.show()
#endif
return true
}
}
```
### Shake to Toggle (Optional)
```swift
extension UIWindow {
open override func motionEnded(_ motion: UIEvent.EventSubtype, with event: UIEvent?) {
super.motionEnded(motion, with: event)
#if DEBUG
if motion == .motionShake {
if let appDelegate = UIApplication.shared.delegate as? AppDelegate {
appDelegate.debugSwift.toggle()
}
}
#endif
}
}
```
### Open Debugger Programmatically
You can get the debug menu as a standalone `UIViewController` and present it however you like — push, present modally, embed in your own navigation. No floating ball required.
```swift
// 1. Setup (without floating ball)
#if DEBUG
DebugSwift().setup()
// Don't call .show() — no floating ball will appear
#endif
// 2. Get the debug view controller and present it yourself
let debugVC = DebugSwift.debugViewController()
// Push into your navigation stack
navigationController?.pushViewController(debugVC, animated: true)
// Or present modally
let nav = UINavigationController(rootViewController: debugVC)
present(nav, animated: true)
```
#### SwiftUI
Wrap in a `UINavigationController` so the close button and dark nav bar match the FloatingView experience:
```swift
struct DebugViewControllerRepresentable: UIViewControllerRepresentable {
let onDismiss: () -> Void
func makeUIViewController(context: Context) -> UINavigationController {
let debugVC = DebugSwift.debugViewController()
let closeButton = UIBarButtonItem(
image: UIImage(systemName: "xmark"),
style: .plain, target: context.coordinator,
action: #selector(Coordinator.close)
)
closeButton.tintColor = .white
debugVC.navigationItem.rightBarButtonItem = closeButton
let nav = UINavigationController(rootViewController: debugVC)
let appearance = UINavigationBarAppearance()
appearance.configureWithTransparentBackground()
appearance.backgroundColor = .black
nav.navigationBar.standardAppearance = appearance
nav.navigationBar.scrollEdgeAppearance = appearance
nav.navigationBar.compactAppearance = appearance
nav.overrideUserInterfaceStyle = .dark
return nav
}
func updateUIViewController(_ uiViewController: UINavigationController, context: Context) {}
func makeCoordinator() -> Coordinator { Coordinator(onDismiss: onDismiss) }
class Coordinator: NSObject {
let onDismiss: () -> Void
init(onDismiss: @escaping () -> Void) { self.onDismiss = onDismiss }
@objc func close() { onDismiss() }
}
}
// Usage — fullScreenCover matches the FloatingView full-screen appearance
@State private var showDebugger = false
Button("Open Debugger") {
DebugSwift.debugViewControllerWillPresent()
showDebugger = true
}
// Use onDismiss: on fullScreenCover — not inside the representable — so the
// floating ball is restored even when the sheet is dismissed via Escape/swipe.
.fullScreenCover(isPresented: $showDebugger, onDismiss: {
DebugSwift.debugViewControllerDidDismiss()
}) {
DebugViewControllerRepresentable(onDismiss: { showDebugger = false })
.ignoresSafeArea()
}
```
## 🔧 Troubleshooting
### Apple Silicon Build Issues
If you encounter build errors like `error unsupported Swift architecture` or `DebugSwift.framework only contains x86_64 slice for simulator` on Apple Silicon Macs:
#### Solution 1: Update to Latest Version
Ensure you're using the latest version of DebugSwift which includes full Apple Silicon support:
```ruby
# CocoaPods
pod 'DebugSwift', '~> 1.8.1'
# Swift Package Manager - update to latest
```
#### Solution 2: Use XCFramework Distribution (Recommended)
For faster builds and guaranteed architecture compatibility:
```ruby
pod 'DebugSwift', :http => 'https://github.com/DebugSwift/DebugSwift/releases/latest/download/DebugSwift.xcframework.zip'
```
#### Solution 3: Remove Architecture Exclusions
If you have custom architecture exclusions in your project, remove them:
```ruby
# Remove this from your Podfile or target configuration:
# config.build_settings['EXCLUDED_ARCHS[sdk=iphonesimulator*]'] = 'arm64'
```
#### Solution 4: Clean Build
Clean your build folder and derived data:
```bash
# Xcode
Product → Clean Build Folder (⌘⇧K)
# Command line
rm -rf ~/Library/Developer/Xcode/DerivedData
```
### Build Performance
- **XCFramework Distribution**: Up to 50% faster build times
- **Source Distribution**: Full source access and debugging capabilities
Choose XCFramework for production builds, source for active development.
## Examples
### Enhanced Hierarchy Tree for Deeper Application Insights (Beta)
Harness the Power of Visual Information within the iOS Hierarchy Tree to Uncover Intricate Layouts and Element Relationships in Your Application.
#### How to Use
Simply press and hold the circle button to reveal the Snapshot and Hierarchy for a comprehensive overview.
#### Results:

#### Explore Additional Details
Enhance your understanding by pressing and holding on a specific view to reveal information such as:
- Class
- Subviews
- Background Color
- Specific attributes based on the type (e.g., UILabel: Text, Font, and TextColor).
#### Results:

### App Custom ViewControllers in Tab Bar
```swift
DebugSwift.App.shared.customControllers = {
let controller1 = UITableViewController()
controller1.title = "Custom TableVC 1"
let controller2 = UITableViewController()
controller2.title = "Custom TableVC 2"
return [controller1, controller2]
}
```
### Custom Debug Actions
```swift
// Add custom debugging actions
DebugSwift.App.shared.customAction = {
[
.init(title: "Development Tools", actions: [
.init(title: "Clear User Data") {
UserDefaults.standard.removeObject(forKey: "userData")
},
.init(title: "Reset App State") {
// Your reset logic here
}
])
]
}
```
#### Results:

### App Custom Data
```swift
DebugSwift.App.shared.customInfo = {
[
.init(
title: "Info 1",
infos: [
.init(title: "title 1", subtitle: "title 2")
]
)
]
}
```
#### Results:

### APNS Token Integration
```swift
// In your AppDelegate
func application(_ application: UIApplication, didRegisterForRemoteNotificationsWithDeviceToken deviceToken: Data) {
DebugSwift.APNSToken.didRegister(deviceToken: deviceToken)
// Your existing token handling code
}
func application(_ application: UIApplication, didFailToRegisterForRemoteNotificationsWithError error: Error) {
DebugSwift.APNSToken.didFailToRegister(error: error)
// Your existing error handling code
}
```
## Configuration
### Network Filtering
```swift
// Ignore specific URLs
DebugSwift.Network.shared.ignoredURLs = ["https://analytics.com"]
// Monitor only specific URLs
DebugSwift.Network.shared.onlyURLs = ["https://api.myapp.com"]
```
### Network History Management
```swift
// Clear HTTP/HTTPS request history (useful when switching environments)
DebugSwift.Network.shared.clearNetworkHistory()
// Clear WebSocket connection history
await DebugSwift.Network.shared.clearWebSocketHistory()
// Clear all network data (HTTP + WebSocket)
await DebugSwift.Network.shared.clearAllNetworkData()
// Example: Clear network data when switching environments
DebugSwift.App.shared.customAction = {
[
.init(title: "Environment", actions: [
.init(title: "Switch to Production") {
// Your environment switch logic
DebugSwift.Network.shared.clearNetworkHistory()
},
.init(title: "Switch to Development") {
// Your environment switch logic
DebugSwift.Network.shared.clearNetworkHistory()
}
])
]
}
```
### Manual URLSessionConfiguration Injection
If you create `URLSessionConfiguration` instances **before** calling `DebugSwift.setup()`, you can manually inject the network monitoring protocol:
```swift
// Option 1: Inject into existing configuration
let config = URLSessionConfiguration.default
DebugSwift.Network.shared.injectIntoConfiguration(config)
let session = URLSession(configuration: config)
// Option 2: Get pre-configured default configuration
let config = DebugSwift.Network.shared.defaultConfiguration()
let session = URLSession(configuration: config)
// Option 3: Get pre-configured ephemeral configuration
let config = DebugSwift.Network.shared.ephemeralConfiguration()
let session = URLSession(configuration: config)
// Option 4: Direct protocol class injection (advanced)
var config = URLSessionConfiguration.default
var protocolClasses = config.protocolClasses ?? []
protocolClasses.insert(CustomHTTPProtocol.self, at: 0)
config.protocolClasses = protocolClasses
```
**Note:** This is particularly useful when migrating from other network debugging tools like Netfox or when working with pre-existing URLSession configurations.
### Network Encryption/Decryption
DebugSwift supports automatic decryption of encrypted API responses, making it easier to debug apps with end-to-end encryption.
```swift
// Enable decryption feature
DebugSwift.Network.shared.setDecryptionEnabled(true)
// Register decryption key for specific API endpoints
if let key = "your-32-byte-aes-key-here-123456".data(using: .utf8) {
DebugSwift.Network.shared.registerDecryptionKey(for: "api.example.com", key: key)
}
// Register custom decryptor for complex encryption schemes
DebugSwift.Network.shared.registerCustomDecryptor(for: "api.myapp.com") { encryptedData in
// Your custom decryption logic here
return customDecrypt(encryptedData)
}
```
### Selective Features
```swift
debugSwift.setup(
hideFeatures: [.performance, .interface], // Hide specific tabs
disable: [.leaksDetector, .console] // Disable specific monitoring
)
```
### Beta Features
```swift
// Enable beta features (disabled by default)
debugSwift.setup(
enableBetaFeatures: [
.swiftUIRenderTracking, // Enable experimental SwiftUI render tracking
.networkSessionPersistence // Enable experimental network session history
]
)
```
### SwiftData Browser (iOS 17+)
```swift
import SwiftData
// Define your model registrations
let swiftDataModels: [SwiftDataModelRegistration] = [
.init(Trip.self),
.init(Accommodation.self)
]
// Register one or more containers
DebugSwift.Resources.shared.configureSwiftData(contexts: [
.init(name: "Main", container: appModelContainer, models: swiftDataModels)
])
// Optional: lock browser editing
DebugSwift.Resources.shared.swiftDataReadOnly = true
```
### App Group Configuration
```swift
// Configure app groups for file browser access
DebugSwift.Resources.shared.configureAppGroups([
"group.com.yourcompany.yourapp"
])
```
### Performance Monitoring
```swift
// Configure memory leak detection
DebugSwift.Performance.shared.onLeakDetected { leakData in
print("🔴 Memory leak detected: \(leakData.message)")
}
```
### Push Notification Simulation
```swift
// Enable push notification simulation
DebugSwift.PushNotification.enableSimulation()
// Simulate a notification
DebugSwift.PushNotification.simulate(
title: "Test Notification",
body: "This is a test notification"
)
```
### SwiftUI Render Tracking (Beta)
⚠️ **Beta Feature**: SwiftUI render tracking is experimental and must be enabled explicitly.
```swift
// First enable the beta feature in setup
debugSwift.setup(enableBetaFeatures: [.swiftUIRenderTracking])
// Then enable SwiftUI render tracking
DebugSwift.SwiftUIRender.shared.isEnabled = true
// Configure persistent overlays (stay visible until manually cleared)
DebugSwift.SwiftUIRender.shared.persistentOverlays = true
// Set overlay style (border, borderWithCount, none)
DebugSwift.SwiftUIRender.shared.overlayStyle = .borderWithCount
// Configure overlay duration
DebugSwift.SwiftUIRender.shared.overlayDuration = 1.0
// Enable console logging
DebugSwift.SwiftUIRender.shared.loggingEnabled = true
// Clear render statistics
DebugSwift.SwiftUIRender.shared.clearStats()
// Clear persistent overlays
DebugSwift.SwiftUIRender.shared.clearPersistentOverlays()
```
### Network Session History (Beta)
⚠️ **Beta Feature**: Network session history is experimental, requires iOS 17 or later, and must be enabled explicitly.
```swift
debugSwift.setup(enableBetaFeatures: [.networkSessionPersistence])
// Optional: change how many days sessions are kept and how often new requests are written to disk.
DebugSwift.Network.configureSessionHistory(retentionDays: 14, batchSize: 1)
```
After enabled, the Session History menu appears in the top toolbar. DebugSwift shows all captured network sessions within the retention period(default: 7 days), and you can directly import a full session into Response Modifier rules to mock the complete API state from that session.
---
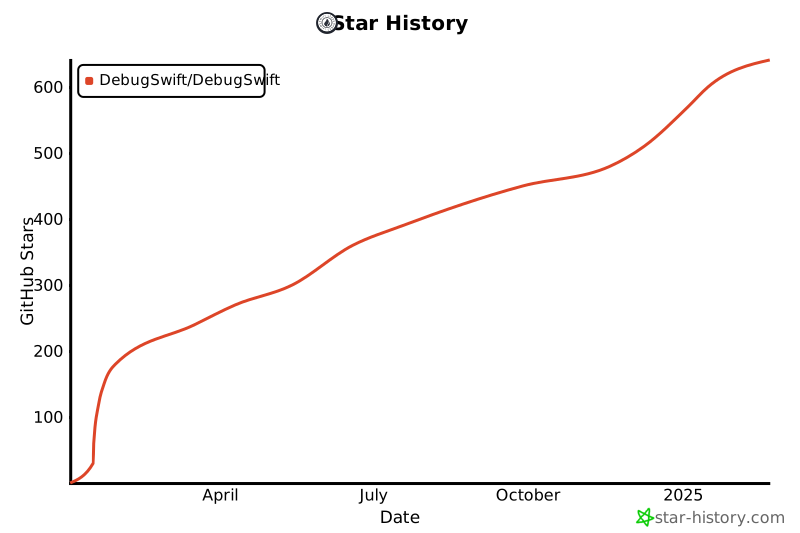
## ⭐ Support the Project
If you find DebugSwift helpful, please consider giving us a star on GitHub! Your support helps us continue improving and adding new features.
[](https://github.com/DebugSwift/DebugSwift)
## Contributors
Our contributors have made this project possible. Thank you!
## Contributing
Contributions are welcome! If you have suggestions, improvements, or bug fixes, please submit a pull request. Let's make DebugSwift even more powerful together!
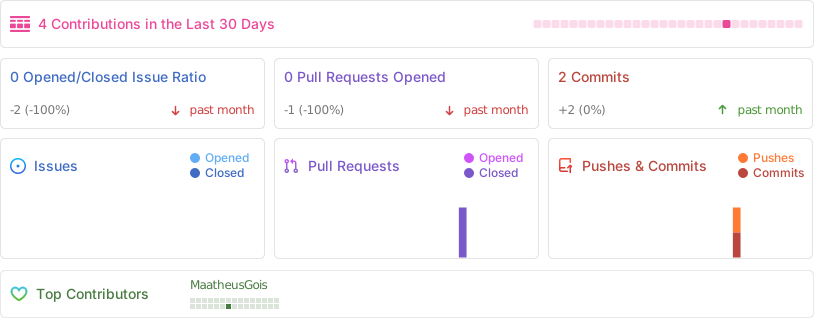
## Repo Activity
## Star History
[](https://star-history.com/#DebugSwift/DebugSwift&Date)
## License
DebugSwift is licensed under the MIT License - see the [LICENSE](LICENSE) file for details.
## References
- [InAppViewDebugger](https://github.com/indragiek/InAppViewDebugger)
- [CocoaDebug](https://github.com/CocoaDebug/CocoaDebug)
- [DBDebugToolkit](https://github.com/dbukowski/DBDebugToolkit)
- [LeakedViewControllerDetector](https://github.com/Janneman84/LeakedViewControllerDetector)



